|
NEWS: The Eagle-Tribune and Andover Townsman wrote an article about my teaching initiatives! Link:
https://www.eagletribune.com/news/merrimack_valley/hometown-hero-ahs-student-15-teaches-coding-during-covid-19/article_b16f13d8-ba4b-519b-a4d6-2108aaa5d5d4.html Over the last couple of weeks, I've also continued working on the visualization component of the reporting engine: I've focused on refining the look of the visualizations and adding a table of rooms with likely sensor issues to the end of the report. I still need to fix formatting & spacing issues with this sensor table, which will conclude the first stage of the development process. Working with matplotlib has been really fun! :) Over the last couple of weeks, a few really exciting things happened: 1. I was named Andover Youth Services' Youth of the Week because of the virtual teaching initiatives I started there! I really appreciate that Energize Andover gave me the freedom to start running a virtual Python class with a group of 5 girls, an experience I eventually used to start virtual technology classes through the Youth Services. 2. While I recently began a summer internship, I have still been working on my Energize projects in my free time. Kate, the PhD student working with Energize through the BU URBAN program, helped me figure out the best way to visually represent the data using matplotlib. I have written a script that generates a PDF of the following visualizations:
I have also separated out the rooms likely to have sensor issues into their own spreadsheet based on certain conditions in the data. I am now making adjustments to the script to refine the visualizations a bit more. EDIT: I forgot to mention that I also started teaching a bit of matplotlib to the new recruits! I showed them my project and explained how it works. Also, here are some sample images of what my visualizations will look like: 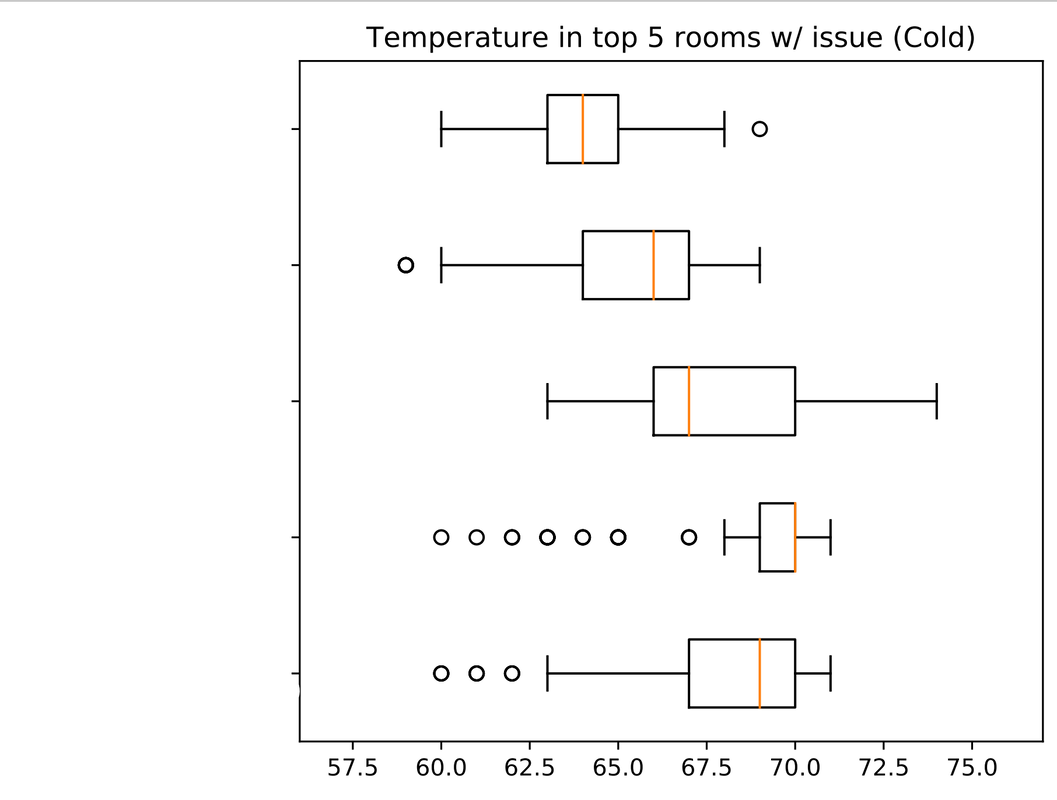 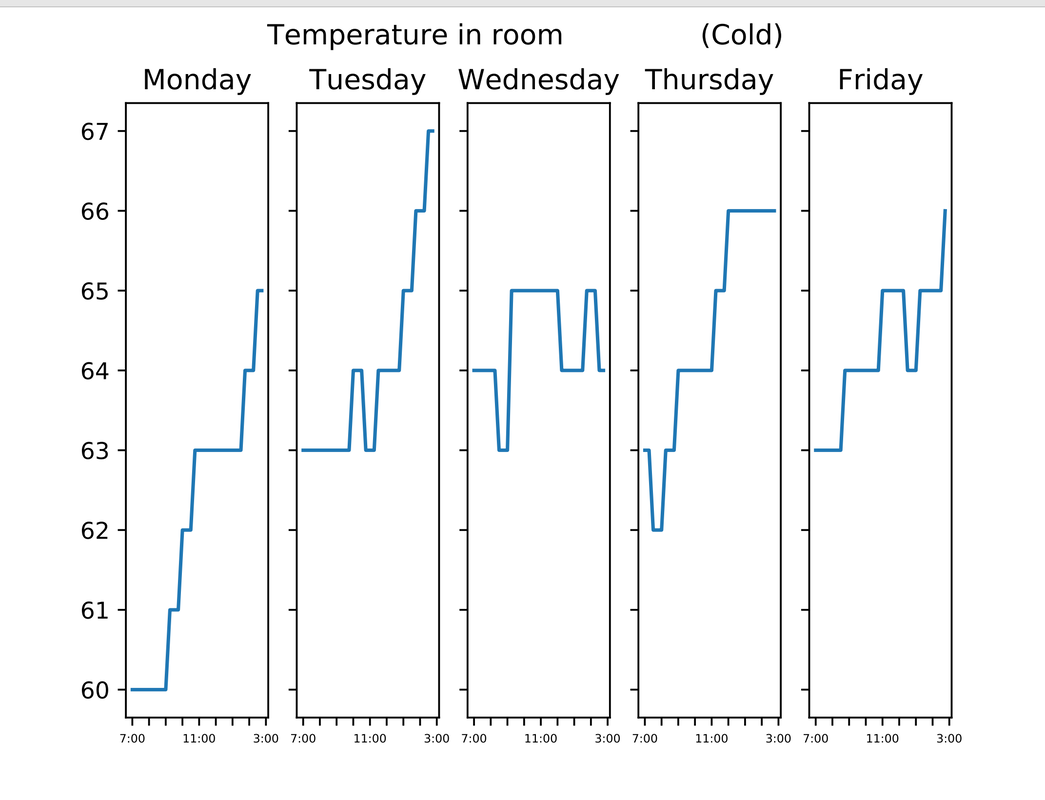 |
AuthorI'm a high school senior and programming enthusiast. Archives
March 2022
Categories |
 RSS Feed
